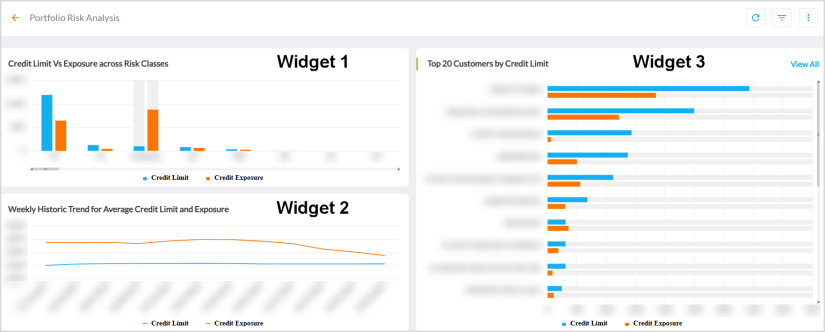
Portfolio Risk Analysis
The Portfolio Risk Analysis dashboard provides insights on the assigned credit limits and credit utilized (exposure) by Customers.
For more details, refer to Viewing Dashboards.
Widget 1 - Credit Limit Vs Exposure across Risk Classes
The Credit Limit Vs Exposure across Risk Classes widget displays a column chart distribution of credit limit and exposure as per risk classes.
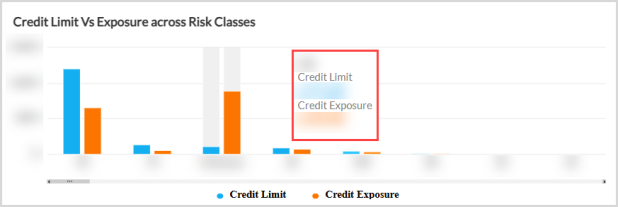
Hovering over the series displays a tooltip![]() A tooltip is used to specify extra information about something when the user moves the mouse pointer over an element. of risk class and the respective values of Credit Limit and Credit Exposure.
A tooltip is used to specify extra information about something when the user moves the mouse pointer over an element. of risk class and the respective values of Credit Limit and Credit Exposure.
Widget 2 - Weekly Historic Trend for Average Credit Limit and Exposure
The Weekly Historic Trend for Average Credit Limit and Exposure widget displays weekly time series trend of credit limit and exposure.
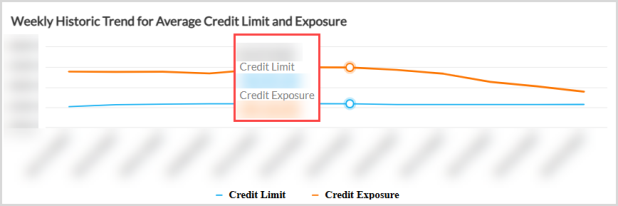
Hovering over the series displays a tooltip of date and the respective values of Credit Limit and Credit Exposure.
Widget 3 - Top 20 Customers by Credit Limit
The Top 20 Customers by Credit Limit widget displays a bar chart distribution of credit limit and exposure of top 20 Customers.
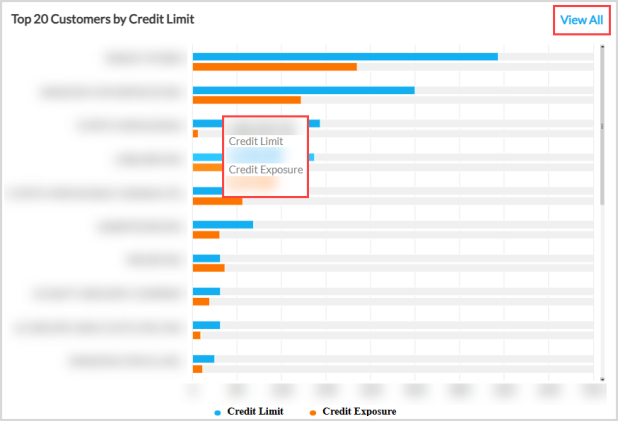
Hovering over the series displays a tooltip of Customer and the respective values of Credit Limit and Credit Exposure.
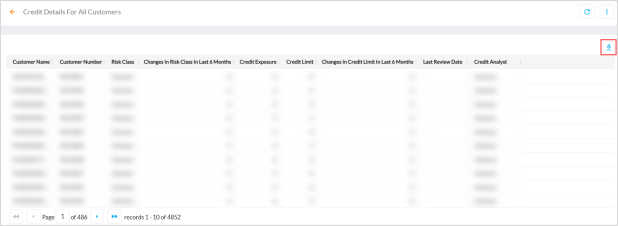
Clicking View All, displays the credit details of all Customers. Click the download icon to export the entire data as a CSV file.
Out-of-the-Box Features
The Out-of-the-Box features and functionalities of the dashboard are as follows:
-
Standard Out of the Box Filters - Filters the entire dashboard based on Country, Company Code, and Risk Class.
-
Kebab Menu - Click this icon to access options such as download, schedule, and mark the dashboard as favorite. For more details, refer to Using Kebab Menu Options.